


Analyzing the attack surface of open source projects
How data analysis of open source contributors can identify supply chain risk


From companies to everyday folks, it seems everyone around the world is impacted by supply chain fragility. Ransomware attacks demonstrate to the masses that conventional industrial supply chains can indeed be threatened by computer network attacks1. When it comes to software supply chains, conventional thinking is that "anything that affects your software,"2 and that "software supply chain risks are inherited from your dependencies"3. Combine this with assumptions that an adversary in cyberspace will seek to attack in the easiest, sometimes inter-discplinary, methods available to them. We are then faced with the challenge of securing the software supply chain against an adversary that may use social engineering, account compromise, long-term reconaissance and infiltration to achieve their goals.
This post examines how the attack surface of an open source project might be analyzed so as to defend against an adversary. Current research4 indicates that open source projects are an effective target for adversaries, who may poison upstream repositories through long-term infiltration and meddling long-term infiltration of dependecy software. This post also demonstrates the of the capabilities of Backchannel's intelligence data platform Parity, and how it can be used for analyzing social cybersecurity5 problems.
Setting up the data
We will be analyzing one of the most popular repositories on GitHub, the machine learning library tensorflow. With 116,262 commits, 3,051 contributors, and a dependency for 150,183 projects, tensorflow is an excellent dataset to analyze some of the social aspects of supply chain security that we will want to look at.
This analysis makes use of Observable, a data analysis platform that is growing in popularity due to its web-interactive graphing and interfaces. The analysis I am doing is synced to the Parity intelligence data platform in a manner that makes the notebook unpublishable, and with native SQL queries that generate data frames. I am making a sample Observable notebook available here, with over a of a +50% sampling of the original dataset. The full, original dataset is available here.
Analyzing contributors to Tensorflow
We can start off by having a look at the top 10 contributors:

The top account, tensorflow-gardener, seems to be some sort of automated CI/CD job that supports the project. It is likely an indirect, not direct, reflection of a human behavior in the project. For this reason we will exclude it from further analysis.
Let's use the domain part of the email (e.g. @___.com) as a proxy for the org where the contributors belong to. This isn't too precise, as an @google.com email bears a close approximation for relating to the google org than the meaning of a gmail.com email may imply. However for the purpose of this experiment it'll do so long as we accept the personal mail usage of some domains.

It should be no surprise that organizations heavily invested in the tech (Google, Nvidia, Intel) are clustered in the bottom-right corner, potentially an indicator of a large number of employee contributors who are assigned to the working on tensorflow related projects.
We can make a fun graph that further demonstrates the degree and magnitude with which these organizations have contributors and contributions to the project.

Apologies for the difficulty in reading the chart, I am still learning to properly style the visualizations in Observable. The Y axis represents the number of commits, in ascending order. The X axis represents the number of contributors, in ascending order.
Some insights:
A company like Google is represented in the bottom right corner because of a high volume of commits as well as a high volume of unique contributors. This maps to the fact they Google invented and supports Tensorflow.
in.ibm.comis an IBM domain that is represented in the bottom left, meaning there are a low volume of unique contributors with a high volume of commits. This particular domain pertains to IBM’s division based in India. There is even some research I found that may represent some of the team in India who works on Tensorflow.
Lexical Analysis
Let’s have a look at the git commit messages attached to these contributions. We can start but obtaining a list of unique words found in commit messages.
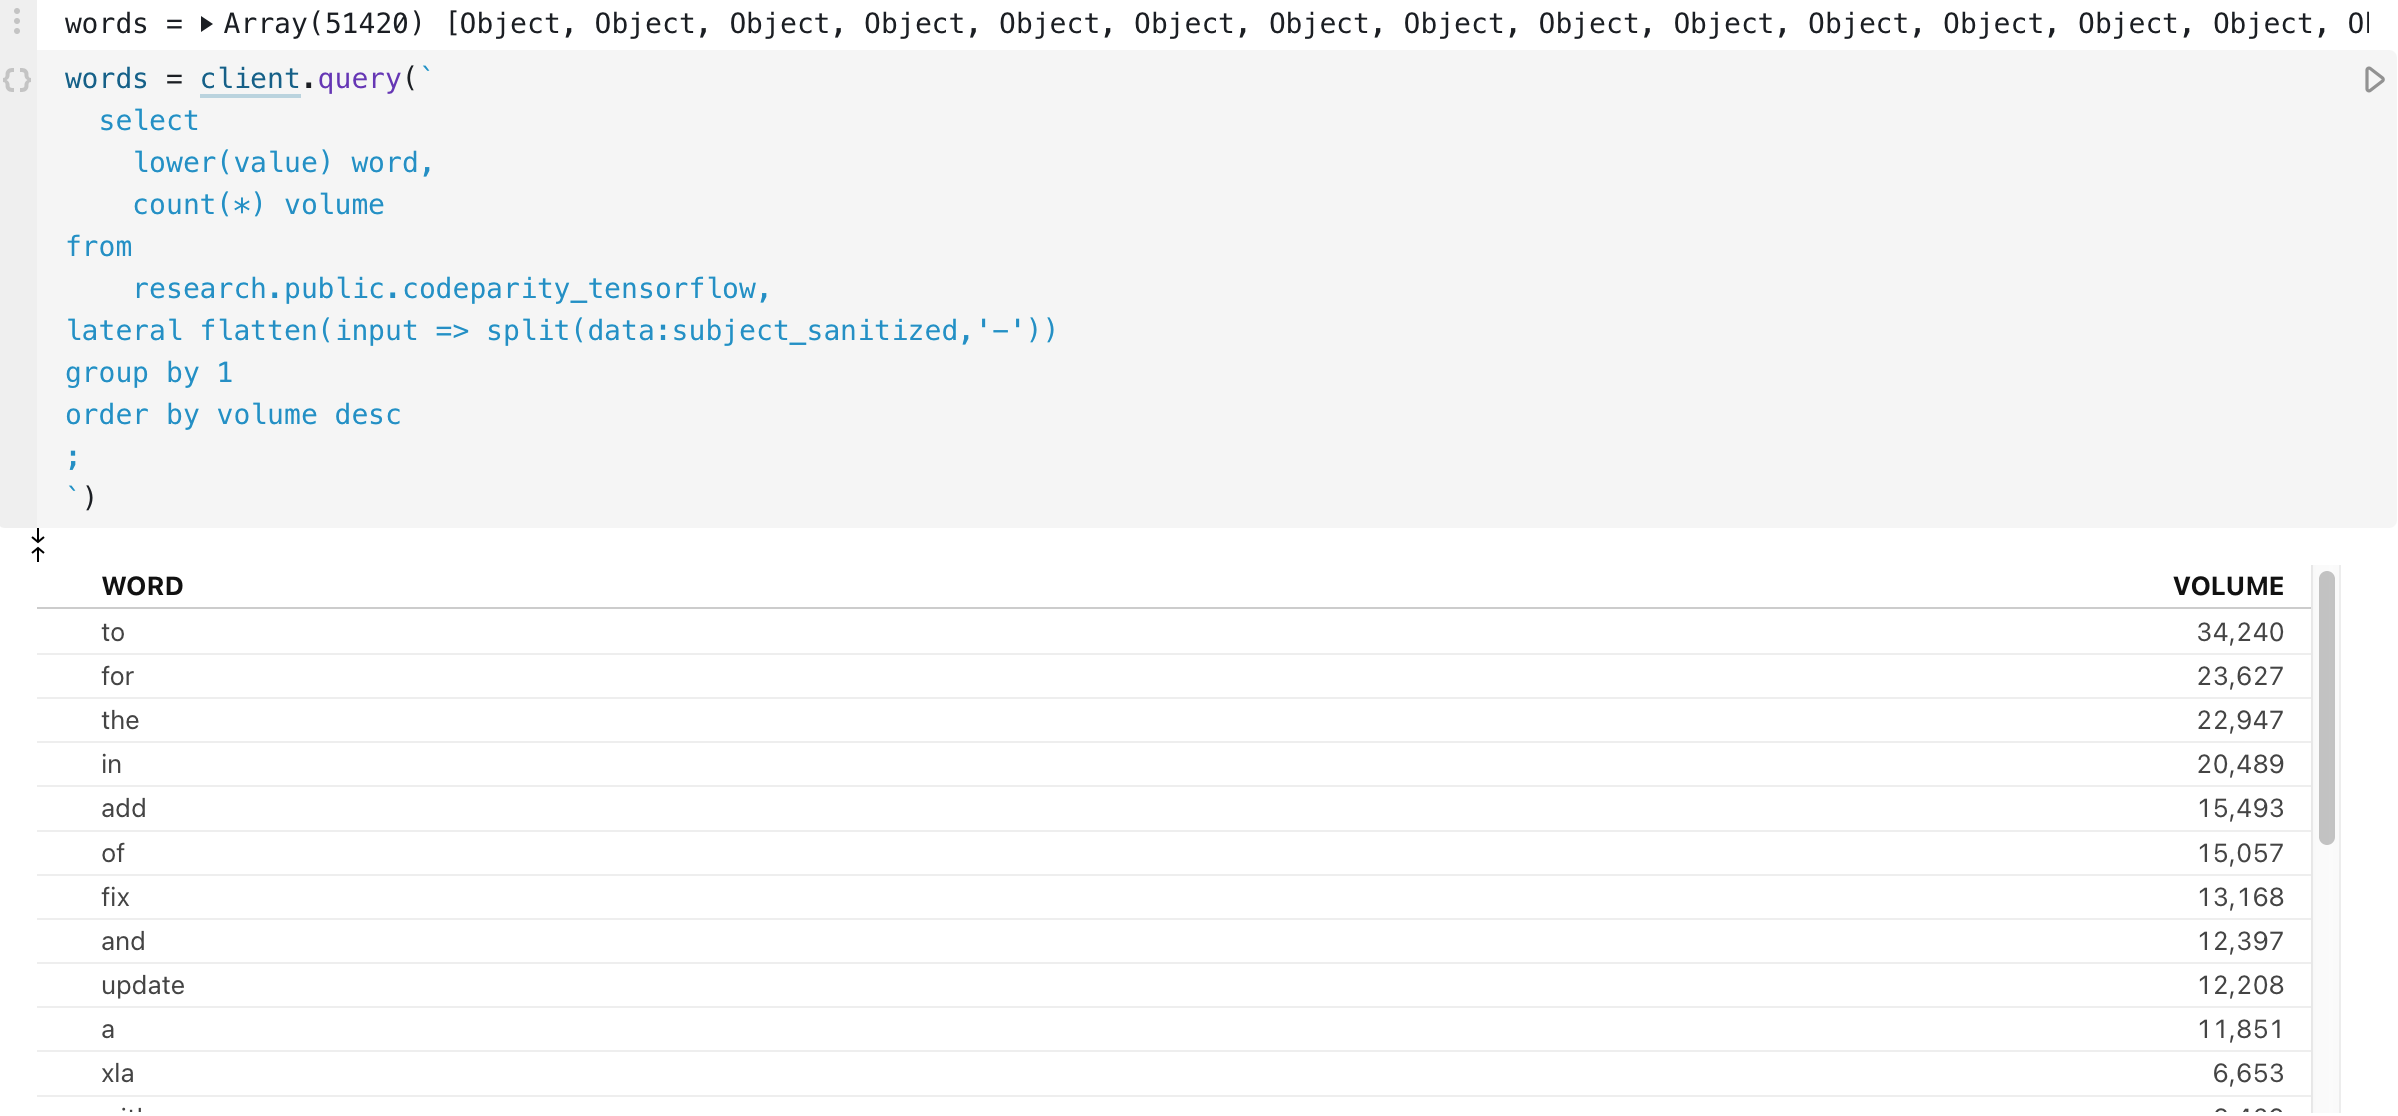
From here it would be fun to make a word cloud. We can start by cutting up the word array a bit. Let's get rid of stop words, then set a maximum amount of words to plot.

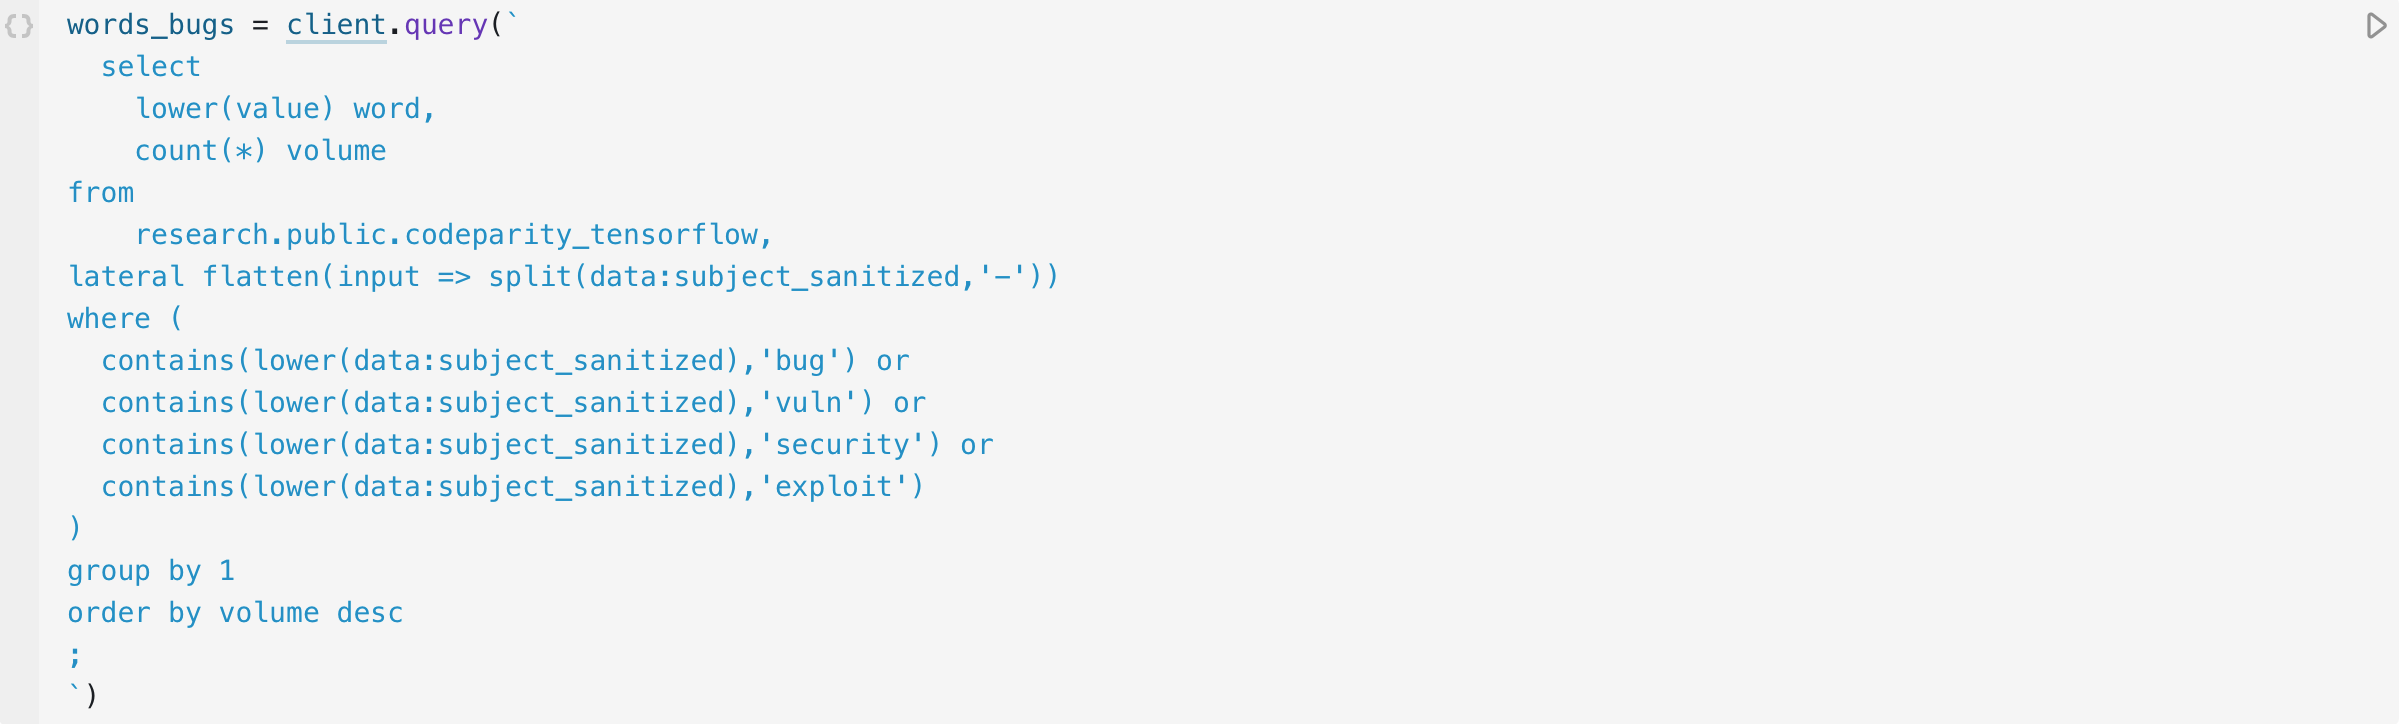
OK, now that we know how to make word clouds, let’s do it again but with a the data explicitly being filtered on commit messages with keywords pertaining to bug fixes and vulnerabilities.

Some insights:
underlying technologies such as Cuda, LLVM, Java, Windows, and iOS are mentioned. It would be interesting from an attacker’s perspective to understand how a bug in Tensorflow may affect these technologies.
further context would make this sort of targeting far more precise. For instance, phrase-based or an extended dictionary of keywords used for selection rather than a small list of security-related keywords.
Analyzing contributors’ exposure to data breaches
sing the haveibeenpwned API, we can assess if any users who are contributors to the project are particularly exposed to the threat of account takeover.
The Parity intelligence data platform has already ingested the enrichment data from haveibeenpwned, so adding it in is as simple as joining a table.

Let’s create a risk scoring based off the following factors.
Breach Risk Score: Breaches will be weighted by how fresh they are. A contributor appearing in a single, very fresh breach will get a breach risk score of 10. A contributor appearing in a single, very old breach will get a breach risk score near 0. These values will compound for the number of breaches the contributor appears in.
Email Risk Score: This will be super fuzzy. We will attempt to classify contributor email based on the type of domain their email contains. Personal emails will get an email risk score of 3.3, educational emails will get an email risk score of 6.6, and corporate emails will get an email risk score of 9.9.
Contributor Risk Score: This will be a compound ranking of the number of commits the contributor has made to the project, weighted by how much of a presence their organization has in the project if it is an educational or corporate email. Again, the value will be from 0 to 10.
Let’s make that risk score now. We can start by having a look at the HIBP data for the tensorflow contributors, and pulling out useful extractions like the breach name and the breach data.
We can see that the oldest breach data represented in this sample size is from 2007. We can then rank every entry in this table based off of how “fresh” it is, with any pwn from 2007 being the least fresh and anything from 2021 being the most fresh.

I’m going to cut through all the ranking and normalization of data, and leave you with the final table of risk-scored users containing the underlying risk scores as well as the overall composite risk score.

This leaves us with the most risky contributors to the tensorflow. We now have a fuzzy weighted risk score for each contributor, based on their appearance in data breaches, influence on the project, and whether the account affected by the data breaches is a corporate email.

The use of the no-reply@google.com account is really interesting; why is it being used for development? And why is it in so many data breaches?
Conclusion
This is just an early experiment to test out how data from open source projects can be combined with external enrichment in a data platform that houses threat intelligence like Parity. For future updates, stay tuned to our Substack blog here or the Backchannel twitter @backchannelre.
Associated Press: “Ransomware and Its Role in Supply Chain Attacks.” July 3, 2021
Ibid.
Margin Research: "A Retrospective on Modern Information Operations." April 30, 2021
Kathleen Carley, PhD: Social cybersecurity: an emerging science. Springer. November 16, 2020